Displaying Images in TensorBoard
Quick link: jkjung-avt/keras_imagenet
A while ago, I shared how I used TensorFlow’s tf.data.TFRecordDataset API to speed up data ingestion when training Keras ImageNet models. Since then, I’ve been trying out different data augmentation techniques, as well as different hyper-parameters, as attempts to train ImageNet models from scratch efficiently.
When applying different data augmentation to training data, I considered it quite important to visualize the transformed image data and verify the augmentation make sense. After some studying and trials, I found TensorBoard to be a valuable tool for visualizing images in TensorFlow. I’d like to share how I did it in this post.
Reference
Image data augmentation in TensorFlow
TensorFlow’s tf.image has provided quite some image data transformation/augmentation functionalities. There are also a few other web sites providing valuable information about this same topic, e.g. TensorFlow Image Augmentation using tf.image.
In my jkjung-avt/keras_imagenet project, I used a _parse_fn() to convert a serialized TFRecord string to the image and label. I also made the call to preprocess_image() in that function to do data augmentation “on the fly”. In fact, most of my ‘preprocess_image’ code was copied over from TensorFlow SLIM library’s preprocessing/inception_preprocessing.py. It implemented the following augmentations on ‘train’ images. You could refer to the source code for details: utils/image_processing.py
- random rotation, say -15 to +15 degrees
- random cropping
- random perturbation of brightness, saturation, hue, contrast, etc.
Displaying augmented training images in TensorBoard
When I first implemented random image rotation in utils/image_preprocessing.py, I really wanted check out the augmented training images and made sure my code was doing what I expected it to do. And since my ‘dataset’ code handled images as tensorflow tensors, it was a natural choice for me to use TensorBoard to visualize them.
So I read tensorflow’s official documentation on tf.summary.image, as well as the Displaying image data in TensorBoard example. But I think they didn’t clearly show how my use case could be done. After some thoughts and trials, I decided to create a separate test code for visualizing and verifying my augmented image data. The test code, test_get_dataset.py, just creates the dataset exactly the same way as done in the training code. It then grabs 1 batch of 64 augmented images from the dataset, and uses tf.summary.image() to generate the summary (log) for TensorBoard. In addition, I added a mean_rgb op to verify mean values of the image data. (The mean RGB values should be close to 0.0, since in the dataset code I have subtracted the nominal mean, 0.5, from all RGB values.)
I attached the main part of test_get_dataset.py below for reference. Note that I had to ‘de-normalize’ (scale back and add original mean values to RGB) the images before logging them onto TensorBoard.
  dataset = get_dataset(DATASET_DIR, args.subset, batch_size=64)
  iterator = dataset.make_initializable_iterator()
  batch_xs, batch_ys = iterator.get_next()
  mean_rgb = tf.reduce_mean(batch_xs, axis=[0, 1, 2])

  # convert normalized image back: [-1, 1] -> [0, 1]
  batch_imgs = tf.multiply(batch_xs, 0.5)
  batch_imgs = tf.add(batch_imgs, 0.5)

  summary_op = tf.summary.image('image_batch', batch_imgs, max_outputs=64)

  with tf.Session() as sess:
      writer = tf.summary.FileWriter(log_dir, sess.graph)
      sess.run(iterator.initializer)
      rgb = sess.run(mean_rgb)
      print('Mean RGB (-1.0~1.0):', rgb)

      summary = sess.run(summary_op)
      writer.add_summary(summary)
      writer.close()
To run the test code and visualize images in TensorBoard, I did the following from a terminal:
  $ cd ${HOME}/project/keras_imagenet
  $ python3 test_get_dataset.py train
  ......
  Mean RGB (-1.0~1.0): [-0.01453737 -0.05069828 -0.15326168]
  $ tensorboard --logdir logs/train
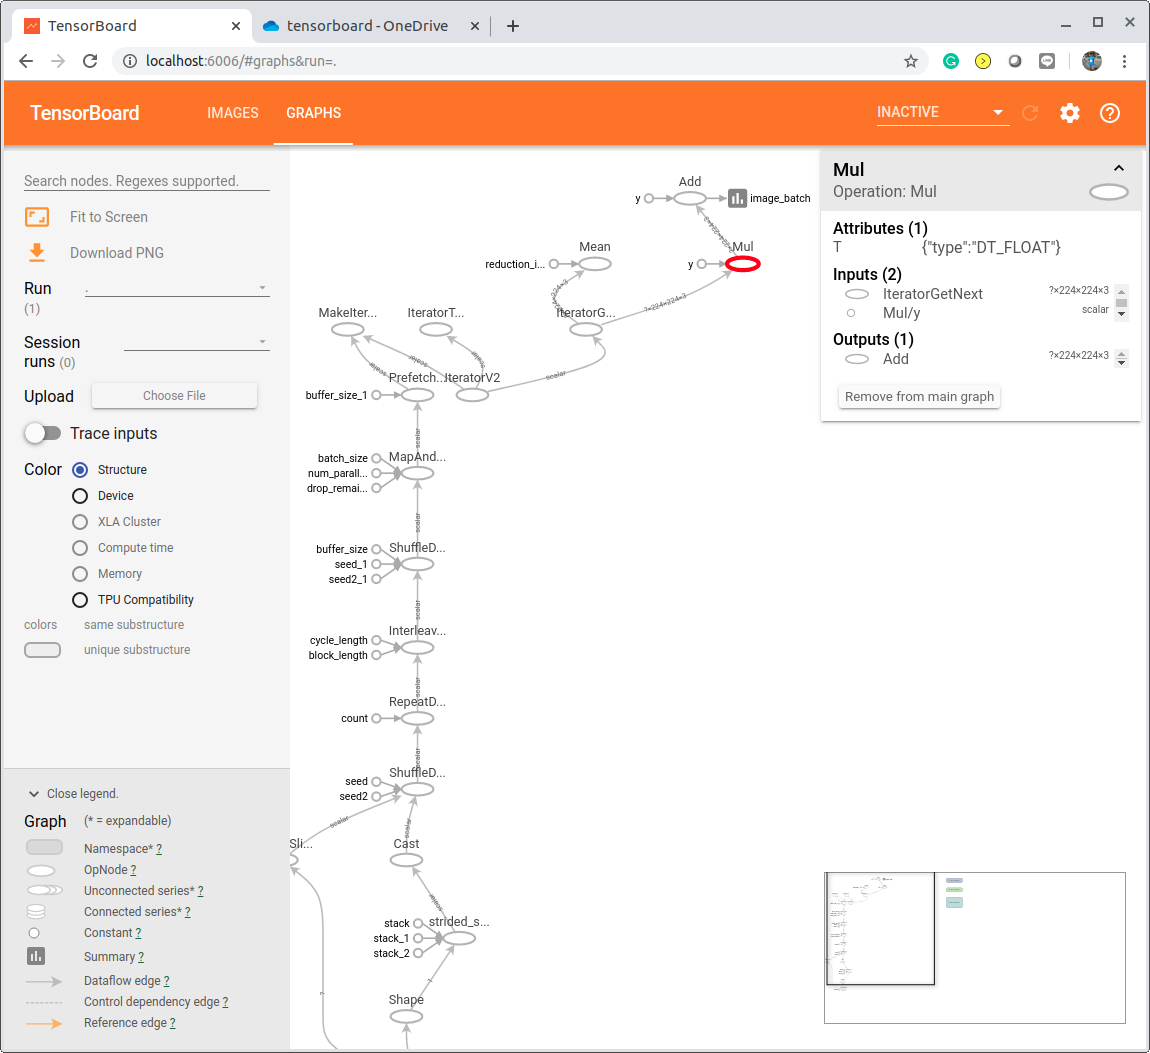
Then I used the web browser to open the link of http://localhost:6006. Here’s a screenshot of the graph created by test_get_dataset.py.
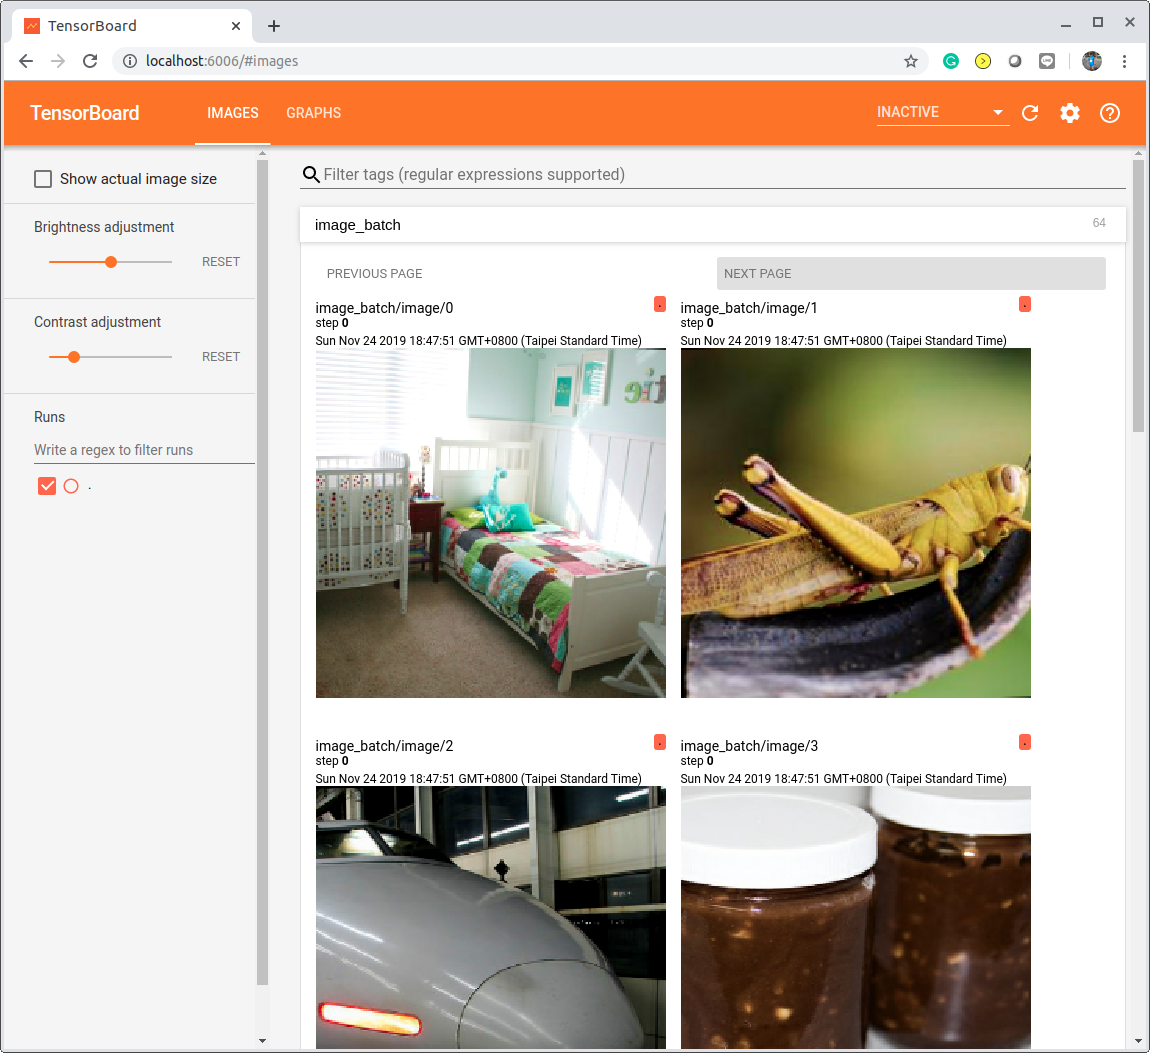
And I could visualize the images by clicking the “IMAGES” tab (on the top) on the page. As a result, I was able to verify the training images were randomly rotated and cropped correctly.